What Happens When You Plot Prime Numbers?
Let's plot prime numbers on a polar axis.

Every once in a while, the Youtube algorithm comes through and actually recommends something interesting.
In this case, it was a video explaining why these spirals are the result of plotting prime numbers on a polar coordinate system, where the radius and angle (in radians) are both the prime number.
Here’s a link to the video.
The explanation involves math that I haven’t thought of since college. And I won’t be able to explain it as well as the video, so you should definitely check it out if you’re interested.
Anyways, it sounded like a fun little project, so I decided to implement it on my own.
Generating Prime Numbers
If we’re going to plot prime numbers, we need a list of prime numbers to plot.
This is the fun part.
Part 1: The Naive Way
Let’s say we want a list of all the prime numbers up to 1,000. The naive way to do it would be to just take every number from 1 to 1,000, and check to see if it’s prime.
# Helper function to check if a number is prime
def is_prime(n):
  # Some base cases
  if n <= 1:
    return False
  if n == 2:
    return True   # 2 is the only even prime

  for i in range(3, n):
    if n%i == 0:
      return False

  return True


primes = []
for i in range(1, 1000):
  if is_prime(i):
    primes.append(i)
This is the simplest solution, and it’s also one of the worst from a computational efficency standpoint. We have 2 nested for loops, aka O(N2) complexity. This means the time to execute grows exponentially.
As a test, let’s write a timer function to see how long it takes to execute.
import time

def timer(f, n):
  t_start = time.time()
  result = f(n)
  t_end = time.time()

  return result, (t_end - t_start)
We can call our timer function, where pass in our naive timer function as f, and n is 100,000.
I ran this and it took 32 seconds to find all primes numbers less than 100,000.
Part 2: The Slightly Optimized Way
Right off the bat, we can do some simple optimizations to our is_prime() function. For instance, in our base cases, we can also check to see if the number is even. If it is, we don’t need to enter that for loop.
There’s a less obvious optimization that can be done here too. In the for loop, we don’t have to check every number up to n. We only have to check numbers up to the square root of n. This is because if n is not prime, then it can be written as the multiplication of 2 factors: n = a * b. If both a and b are numbers greater than the square root of n, then a * b would be greater than n. Therefore, at least one of a or b must be less than the square root of n. So if we can’t find any factors smaller than the square root of n, then n must be prime.
Our new function now looks like:
# Helper function to check if a number is prime
def slightly_optimized_is_prime(n):
  # Some base cases
  if n <= 1:
    return False
  if n == 2:
    return True   # 2 is the only even prime
  if n%2 == 0:
    return False

  for i in range(3, int(n**0.5)+1):
    if n%i == 0:
      return False

  return True
This slightly optimized function took 0.134 seconds to find all of the primes under 100,000. Remember that our naive approach took 32 seconds, so our new approach is about 240x faster.
Part 3: The Sieve of Eratosthenes Method
One of the most efficient ways of generating lists of prime numbers is the Sieve of Eratosthenes (I know, funny name).
This algorithm works by first generating a list of length n of possible flags, where each flag is a boolean denoting a possible prime number.
Start by setting the flags at locations 0 and 1 as False, since 0 and 1 are not prime numbers.
Then, starting at 2 (the first prime number), mark all flags at location 22 and each following increment of 2 as False. Then loop through the rest of the flags array in this manner, setting each square and increment greater than the square as False.
The final list of prime numbers are the indices of True values in the flags array.
# We'll use numpy since it's awesome
import numpy as np

def primes_sieve(n):
  # Array of possible primes
  primes = np.ones(n, dtype=bool)

  # 0 and 1 are not prime numbers
  primes[0] = False
  primes[1] = False

  for i in range(2, n):
      if primes[i]:
          primes[i**2::i] = False

  # Prime numbers are the indices of the True values
  return np.flatnonzero(primes)
This method took 0.013 seconds to find all prime numbers less than 100,000. Or about 2,460x faster than our naive approach.
Part 4: The Sieve Supercharged
I went searching on the internets for the fastest implementation of the sieve method. I found one that works on numbers greater than 3. So I just modified it to add 2 to the beginning of the array before returning it.
import numpy as np

def primes_sieve_supercharged(n):
    sieve = np.ones(n // 2, dtype=np.bool)

    for i in range(3, int(n**0.5) + 1, 2):
        if sieve[i // 2]:
            sieve[i * i // 2::i] = False

    return np.concatenate(([2], 2 * np.nonzero(sieve)[0][1::] + 1))
This supercharged method took 0.000247 seconds to find all of the prime numbers under 100,000. This is 130,000x faster than our naive approach. If that doesn’t put a smile on your face, I don’t know what will.
How Long…
… do these methods take to find all of the prime numbers under 10,000,000?
I’m going to skip our naive approach, because it would take forever.
- Slightly Optimized Way: 95 seconds
- Sieve of Eratosthenes: 1.07 seconds
- Sieve Supercharged: 0.024 seconds
Remember that our slightly optimized way only took 0.13 seconds to find all the primes up to 100,000. And now it takes 95 seconds to find all the primes up to 10 million. This is exponential growth and this is why it’s important to think about algorithm efficiency.
Ok Let’s Plot Some Primes!
This is where the art happens, and was the motivation for the whole project.
I’ll admit, I had more fun with the prime numbers. I know, I’m a nerd.
Most of us think of Cartesian coordinates when we think about plotting points. That’s the (x, y) thingy, remember?
Can you think of what it would look like to plot all the prime numbers where both x and y are the prime?
Hint, what would a plot of (2, 2), (3, 3), (5, 5), (7, 7)… look like?
Yeah, it’s a straight line.
Boring.
We’ll plot them on on circles (polar).
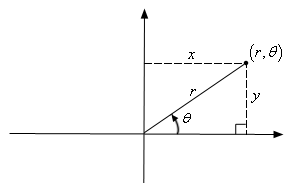
Polar coordinates are defined by a radius (r), and angle (theta). These are circles because the angle resets to zero after 360o (2π radians). Note than 180o is π radians.
What we’ll plot is the prime number for both the radius and the angle in radians.
import matplotlib.pyplot as plt

def polar_plot(r, theta, area=0.01, show_grid=True):
    bg_color = '#000000'

    fig = plt.figure()
    ax = fig.add_subplot(111, projection='polar')
    ax.set_yticklabels([])

    if not show_grid:
        ax.grid(False)
        ax.set_facecolor(bg_color)
        fig.patch.set_facecolor(bg_color)

    ax.scatter(r, theta, marker="o", s=area)
    plt.show()
The function polar_plot() has two required arguments, r and theta. These are our lists of prime numbers. The optional area argument sets the size of the dot that is plotted. And show_grid shows the coordinate system when True, and a black background when False. Cause, you know, art!
We’ll generate 10,000,000 prime numbers, and plot various amounts to see what we get.
The first 100:
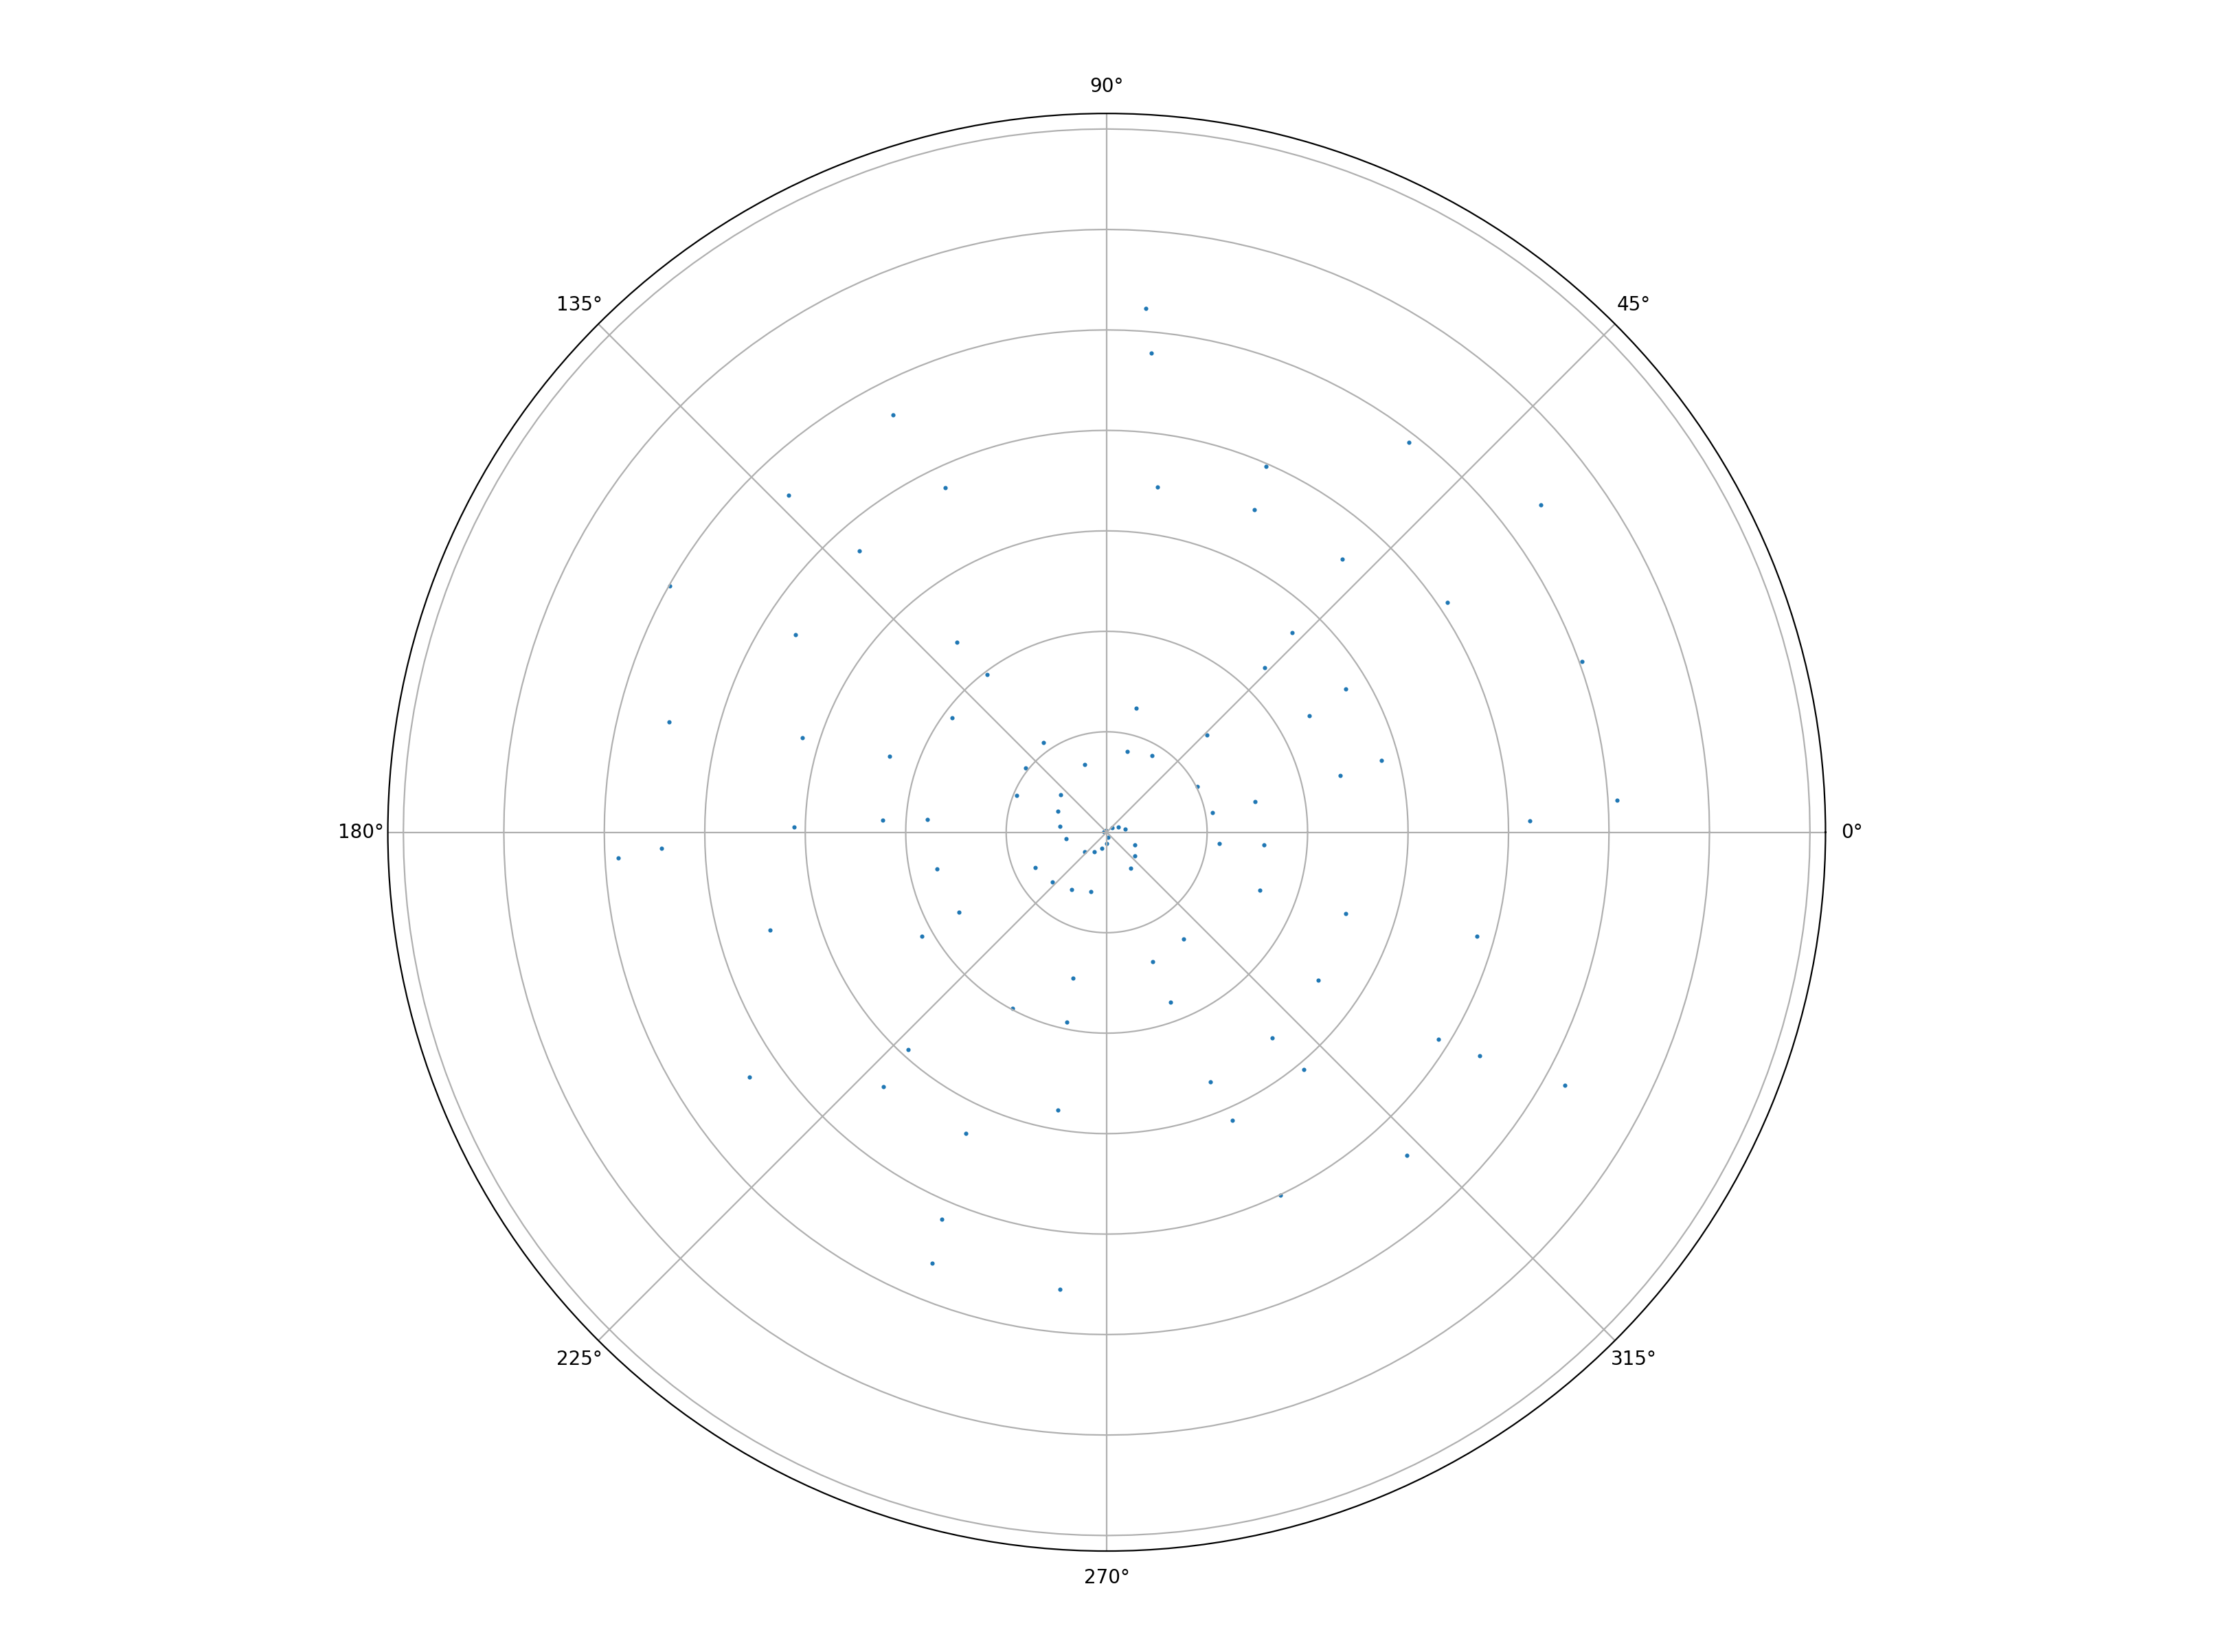
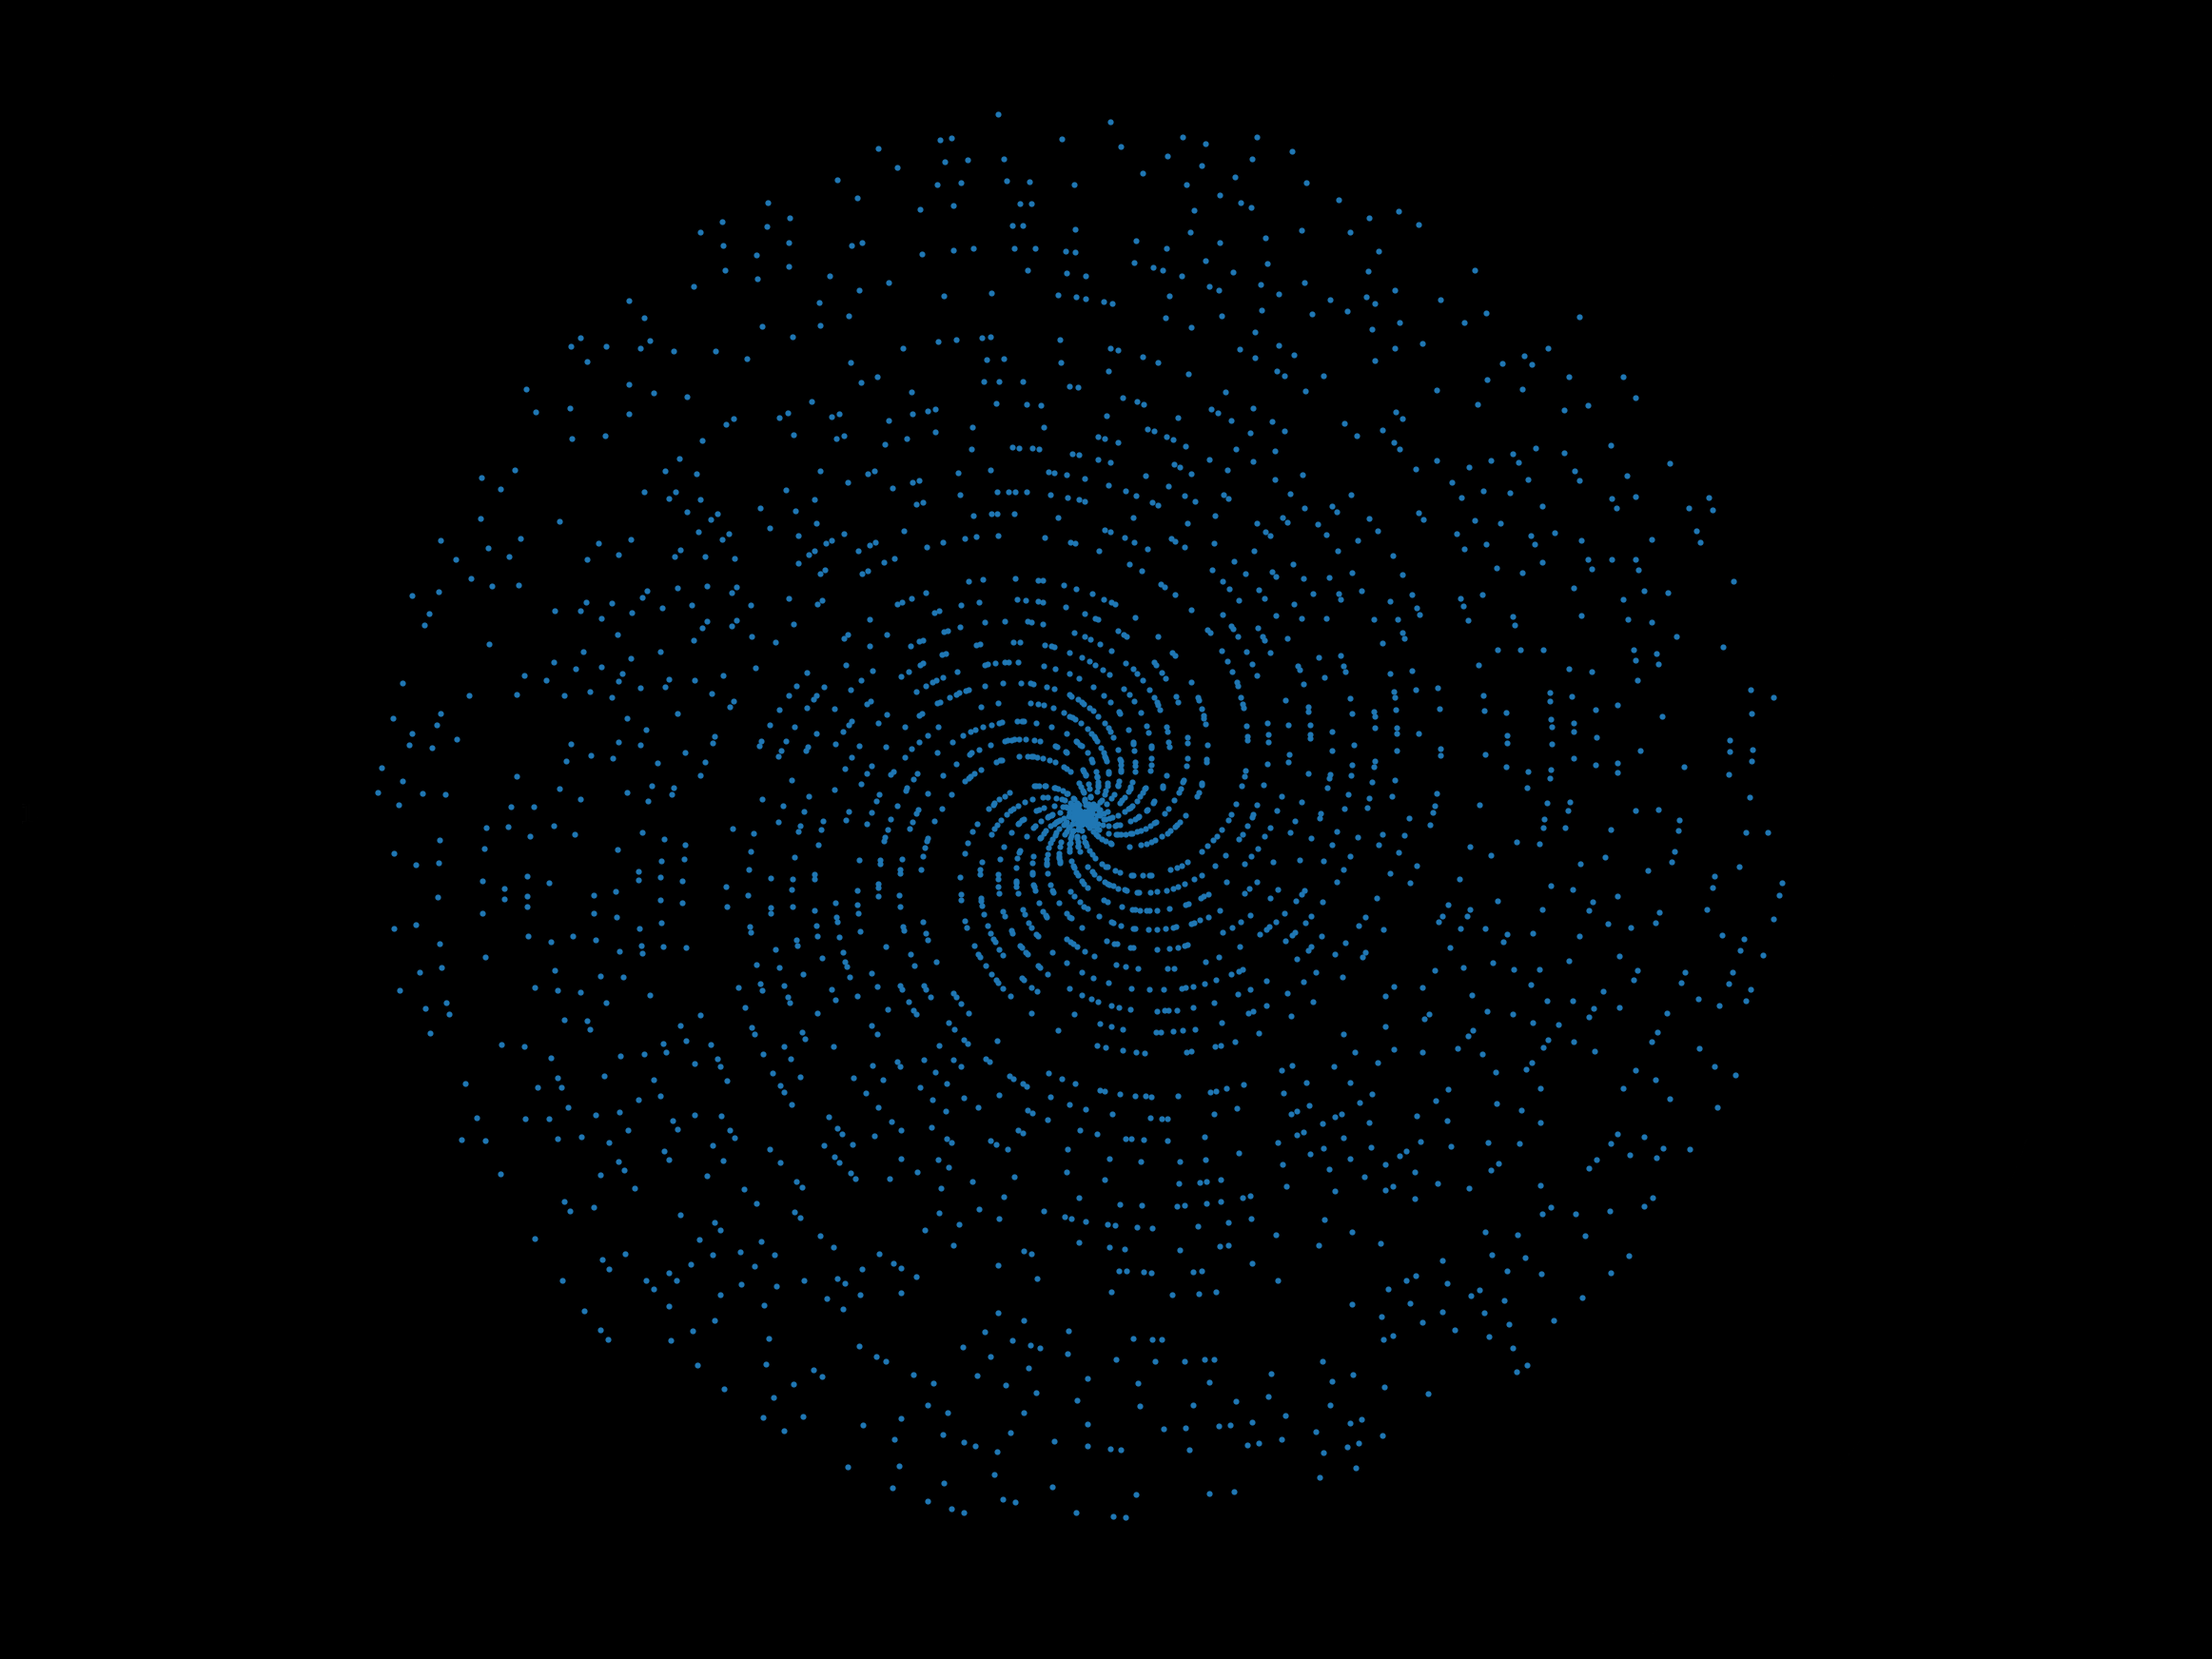
2,500:
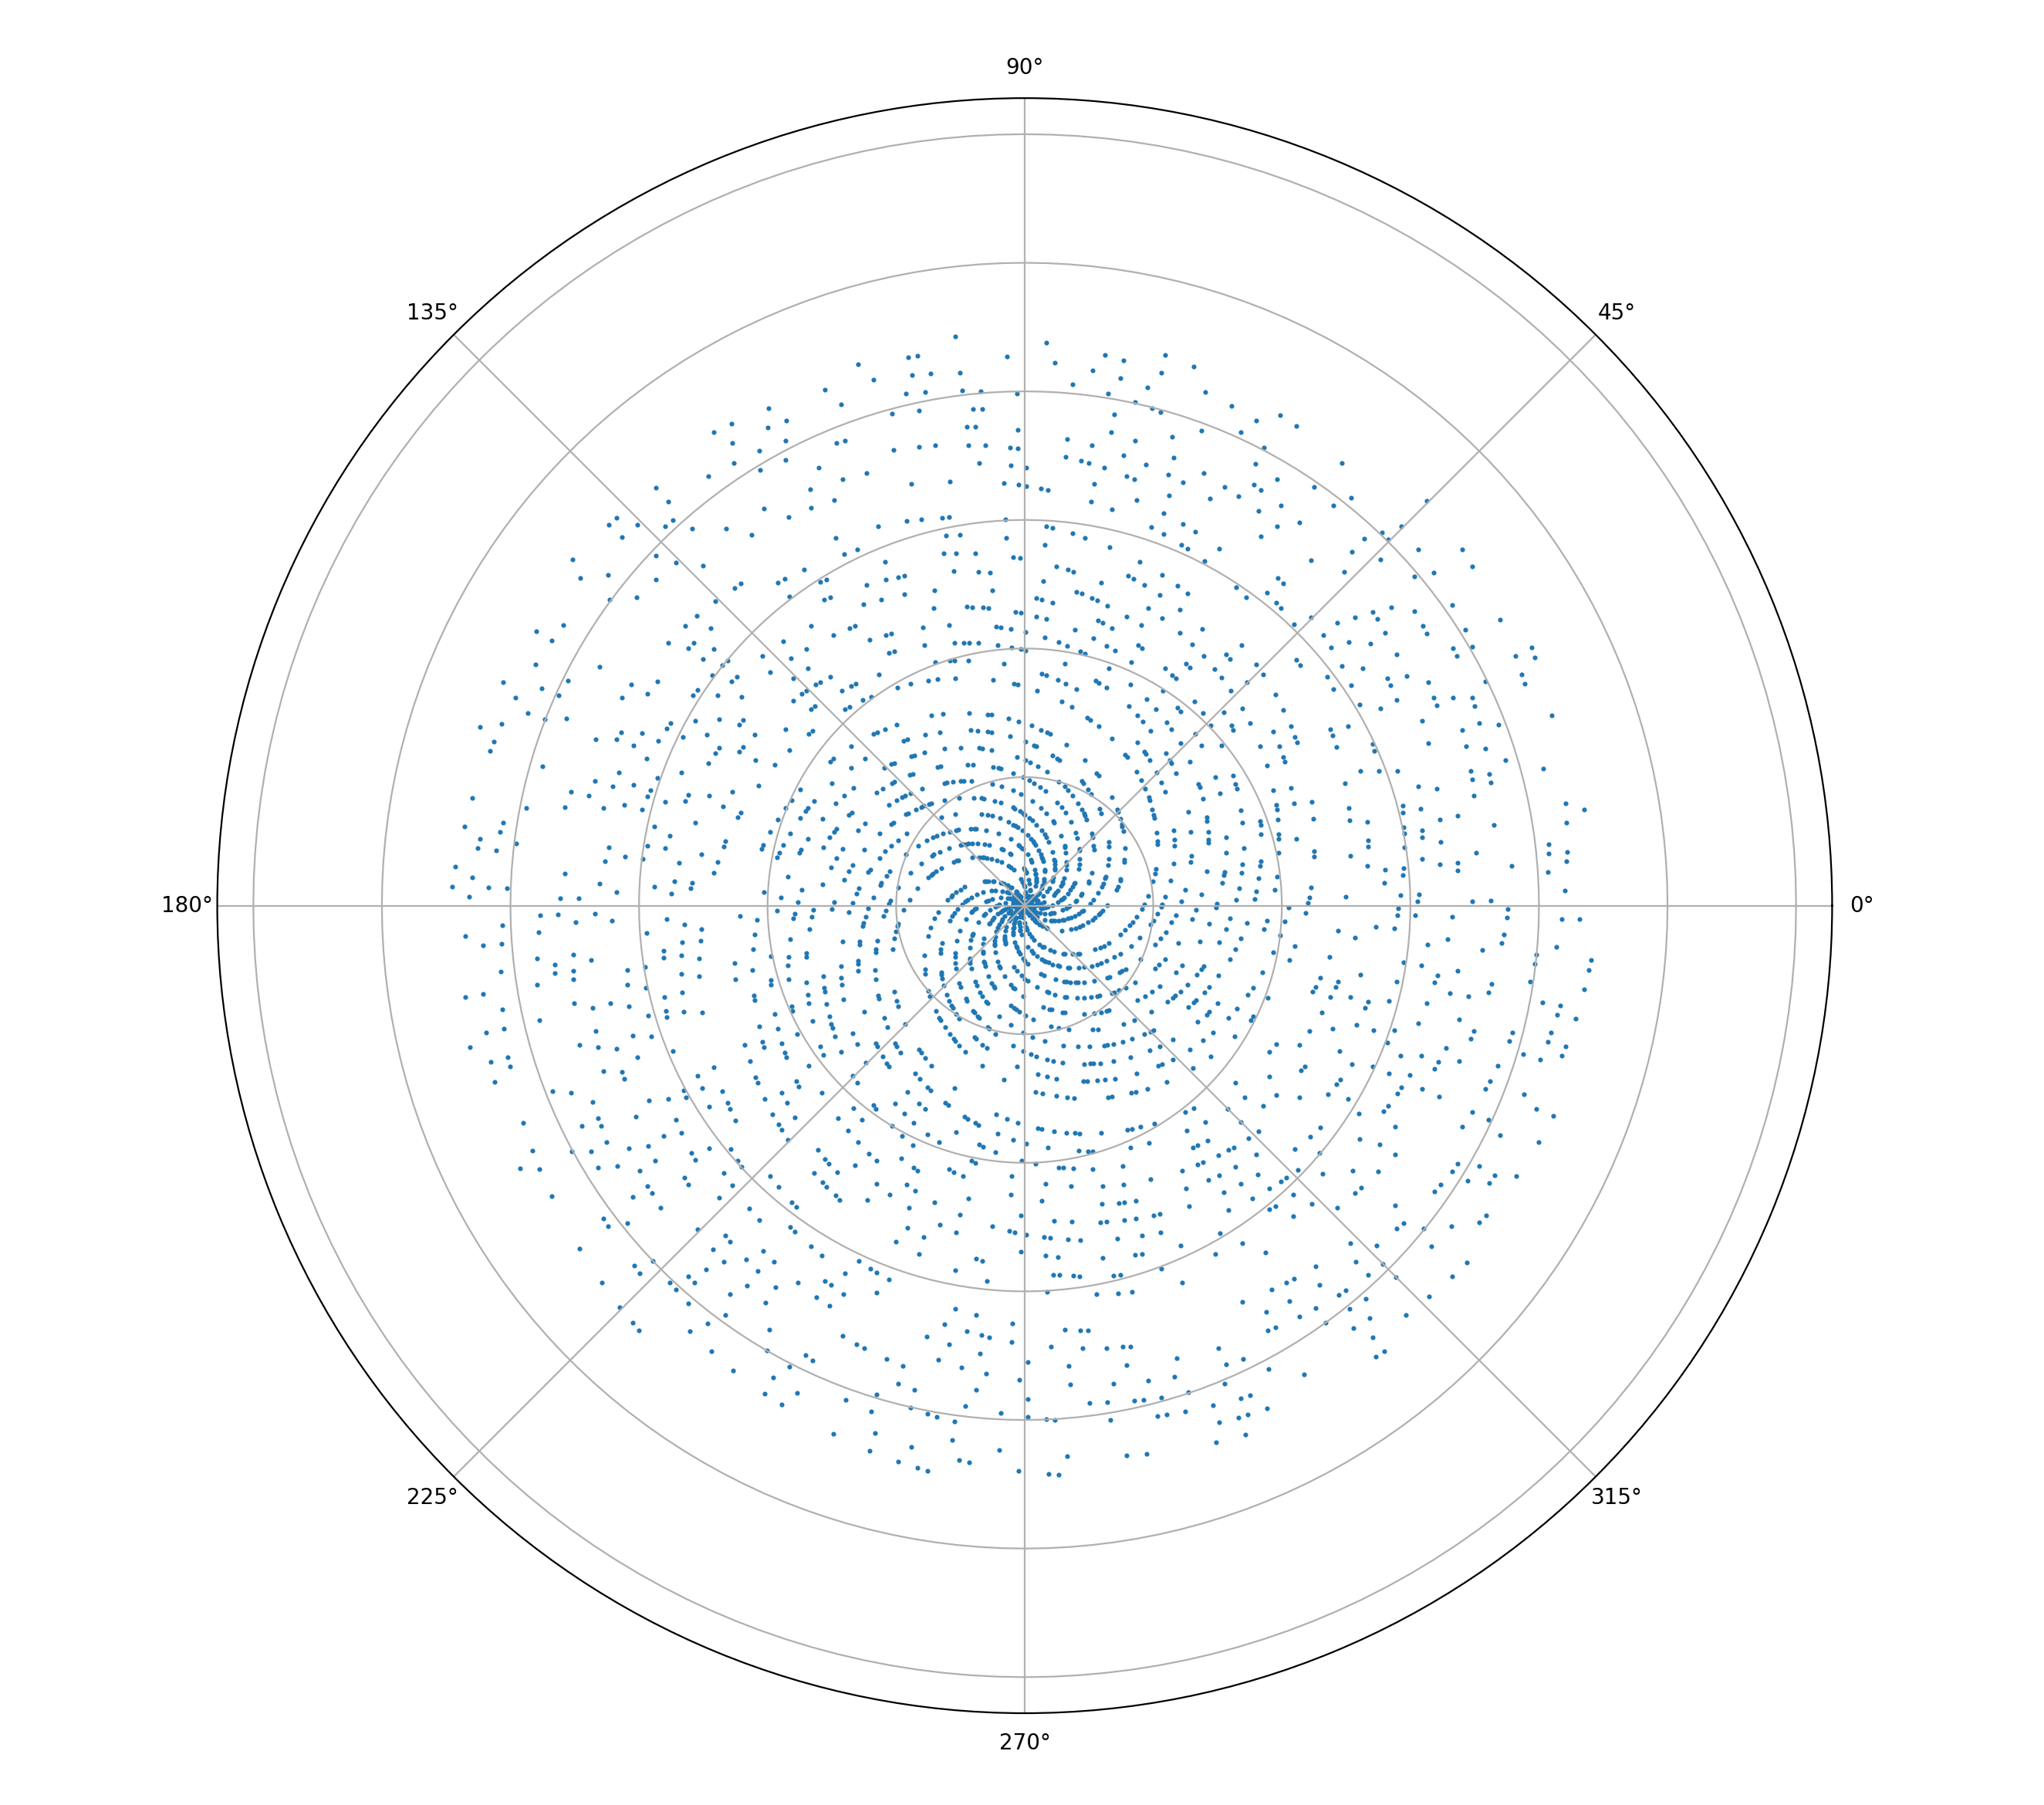
100,000:
2,500 looks pretty interesting.
Now Let’s Make Them Look Good
100:

2,500:
100,000:
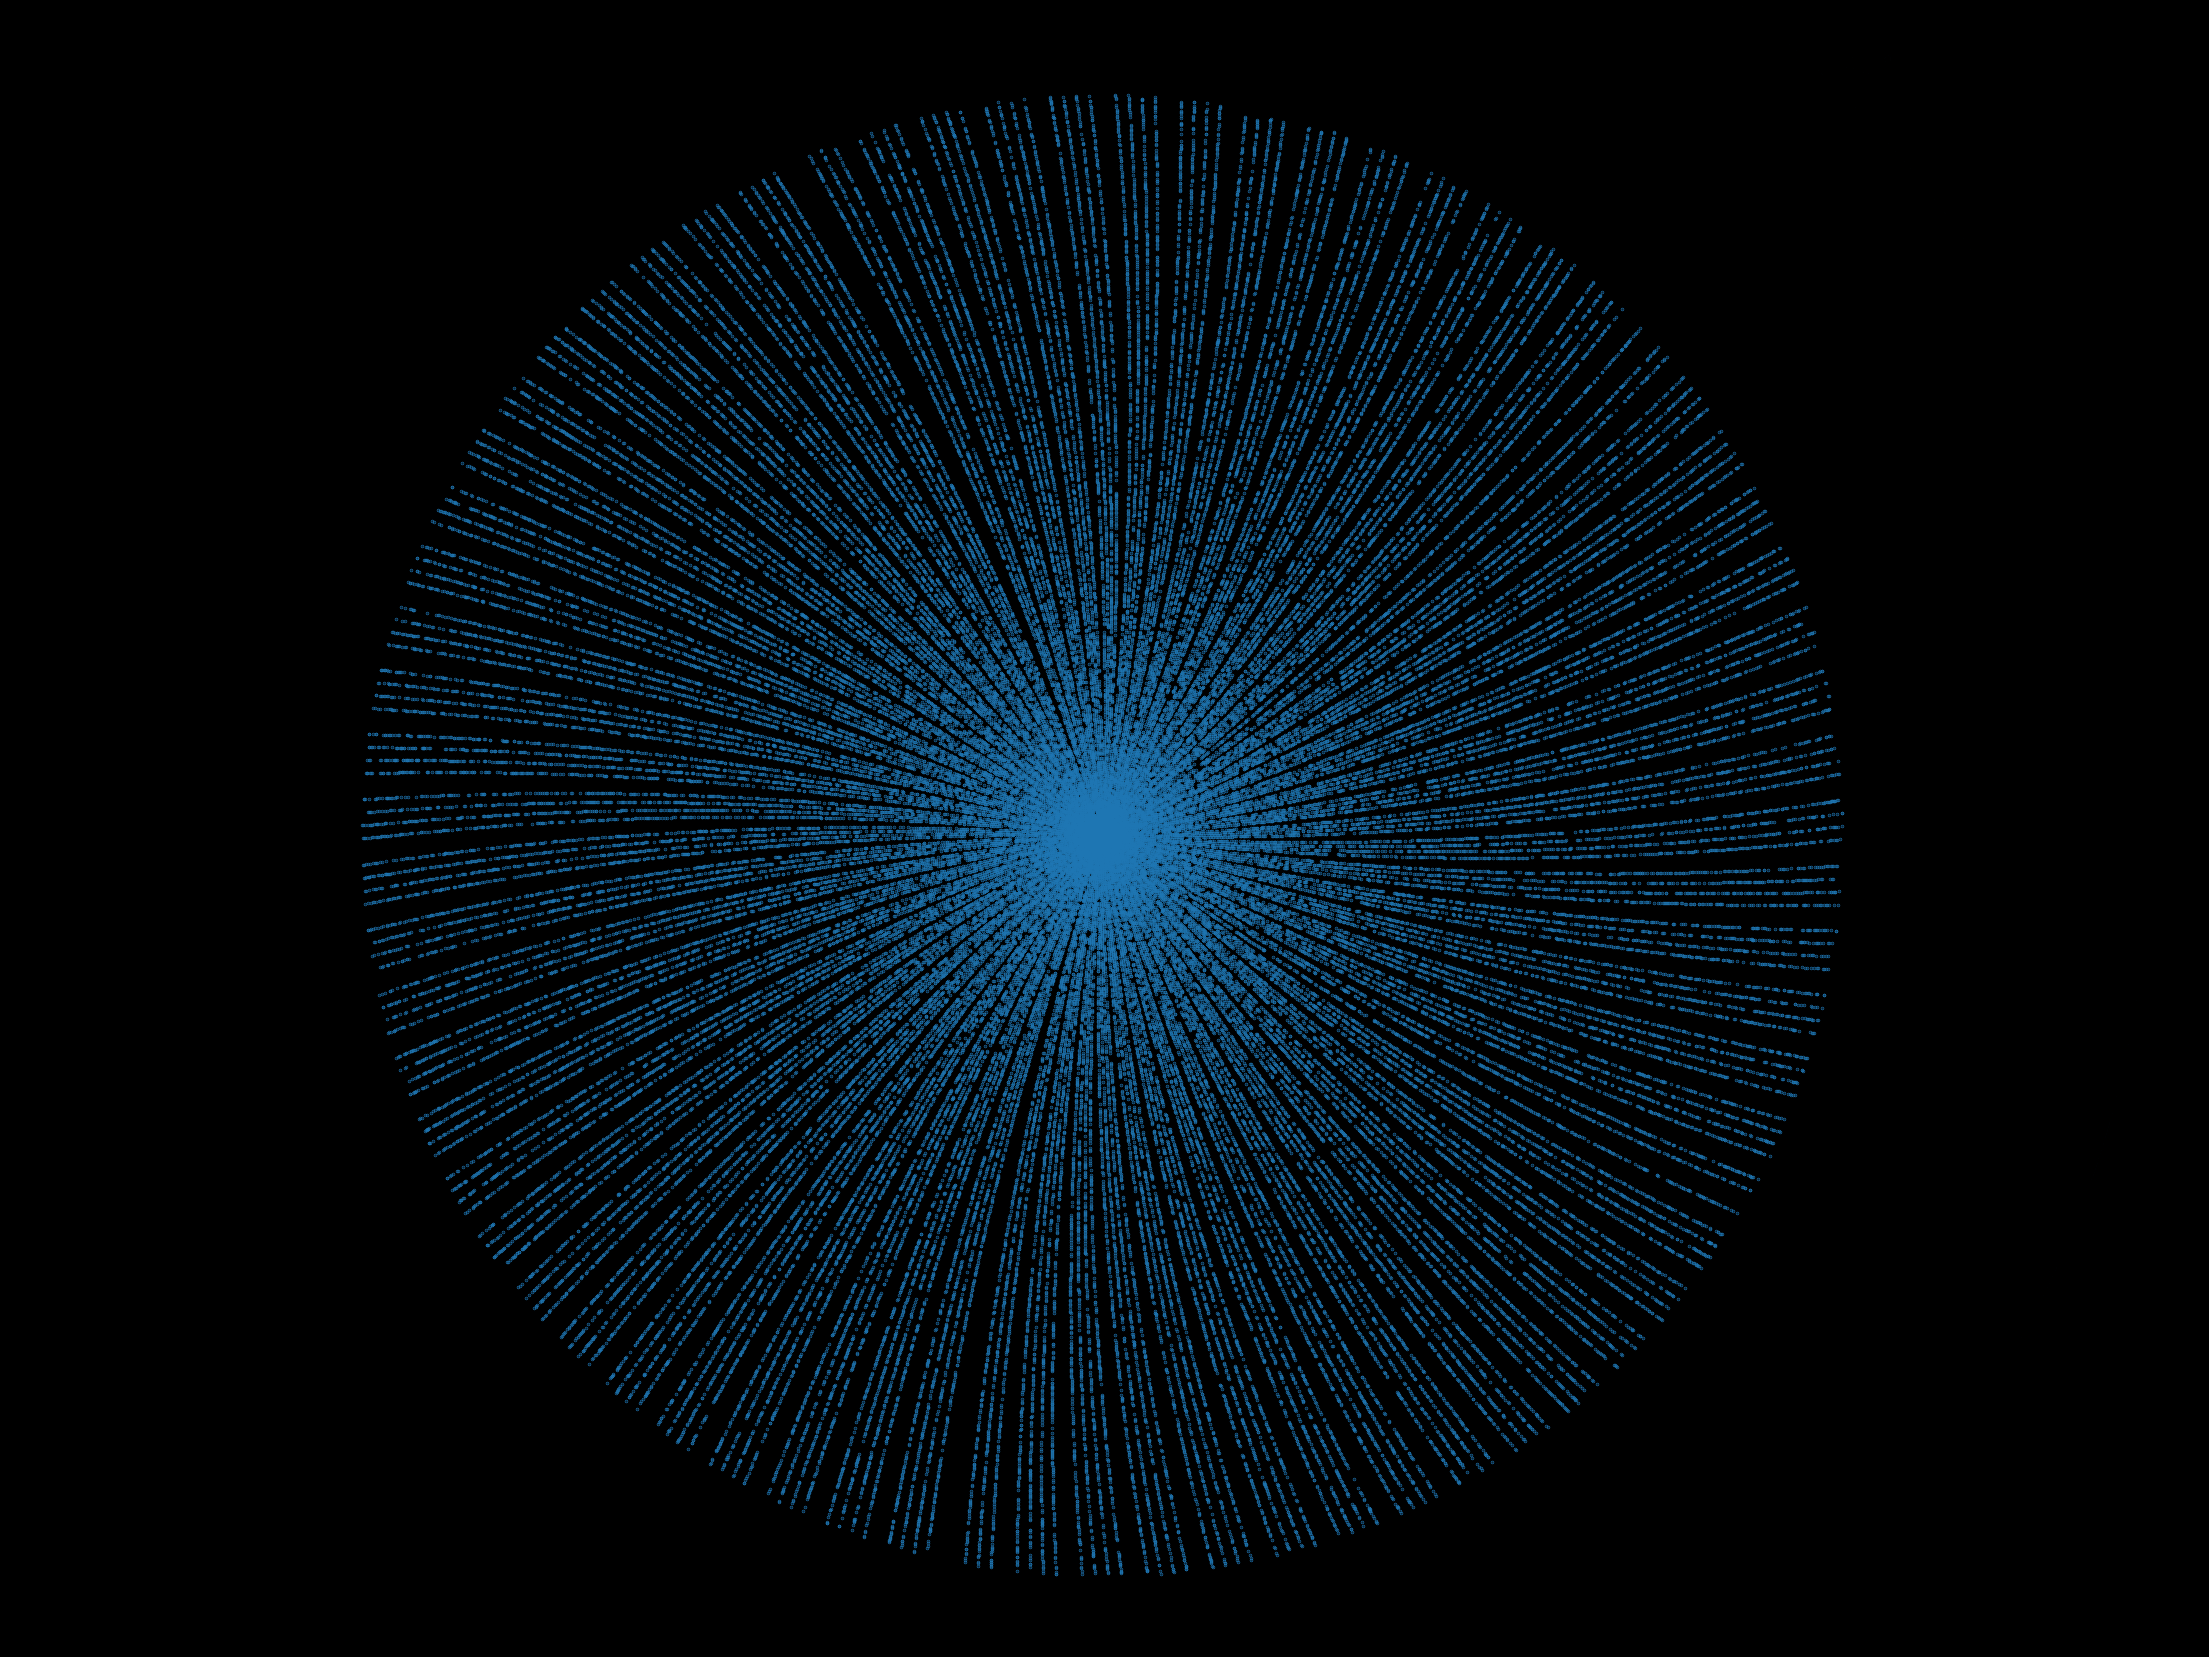
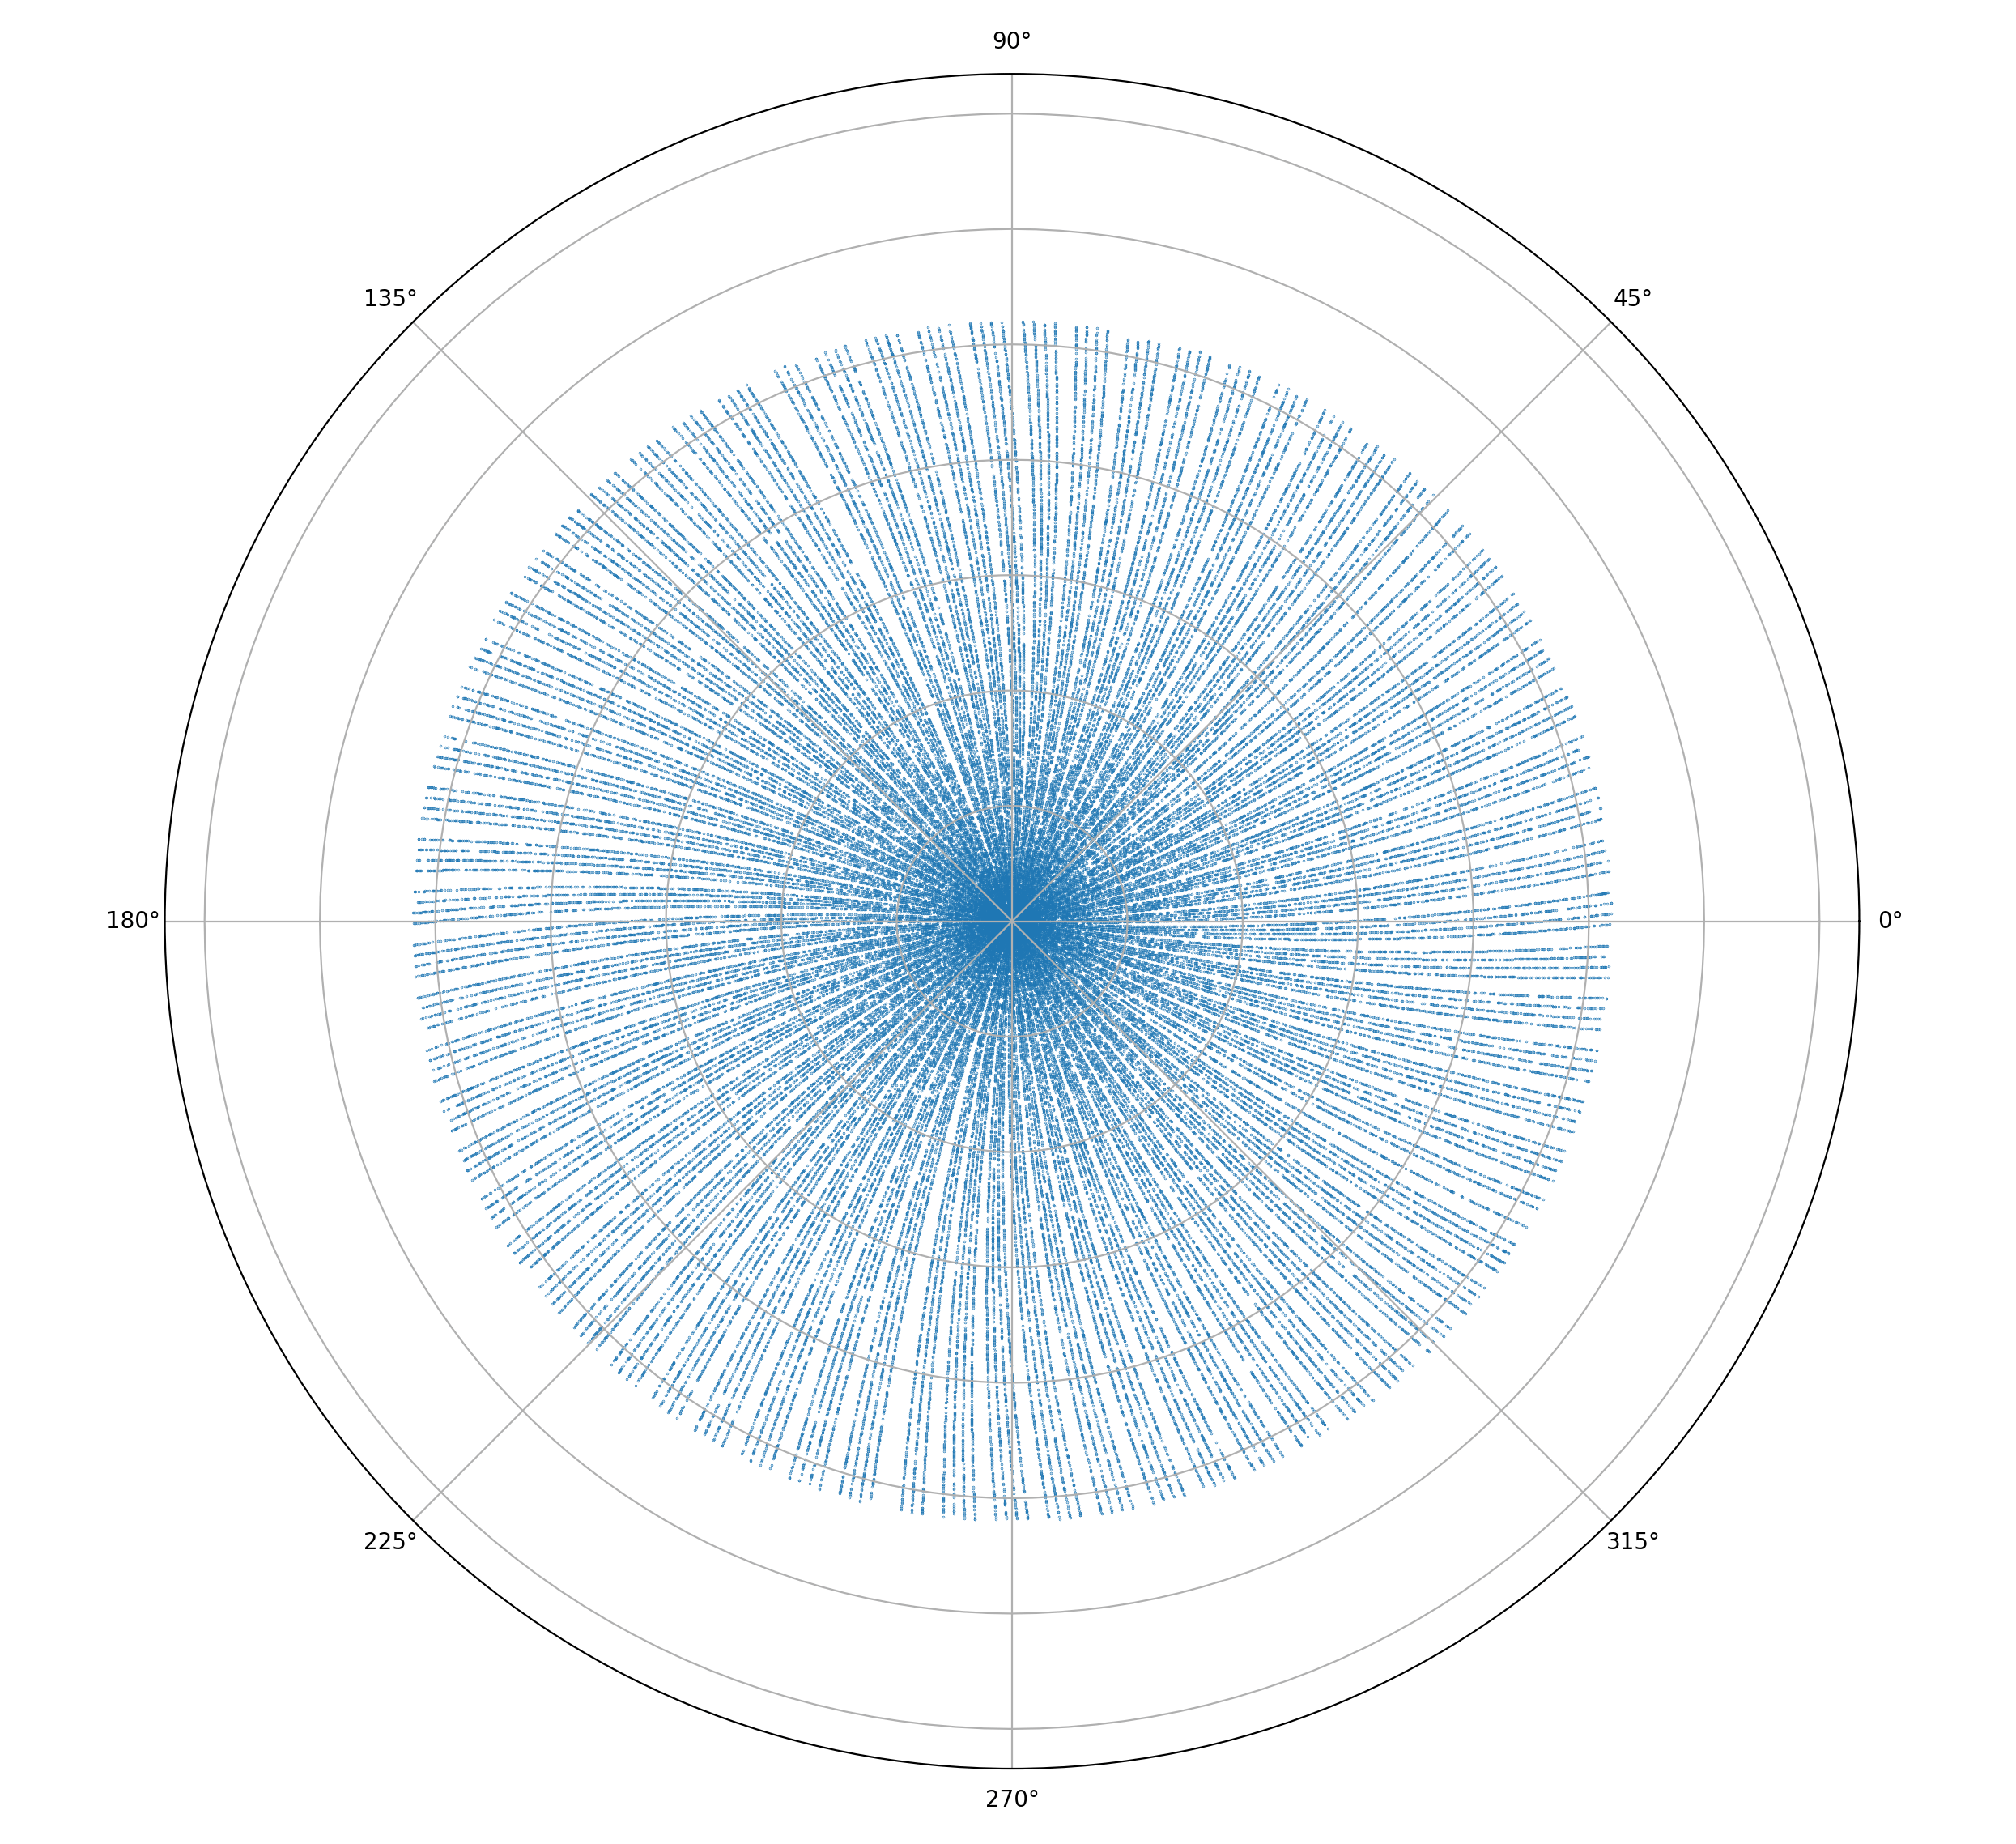
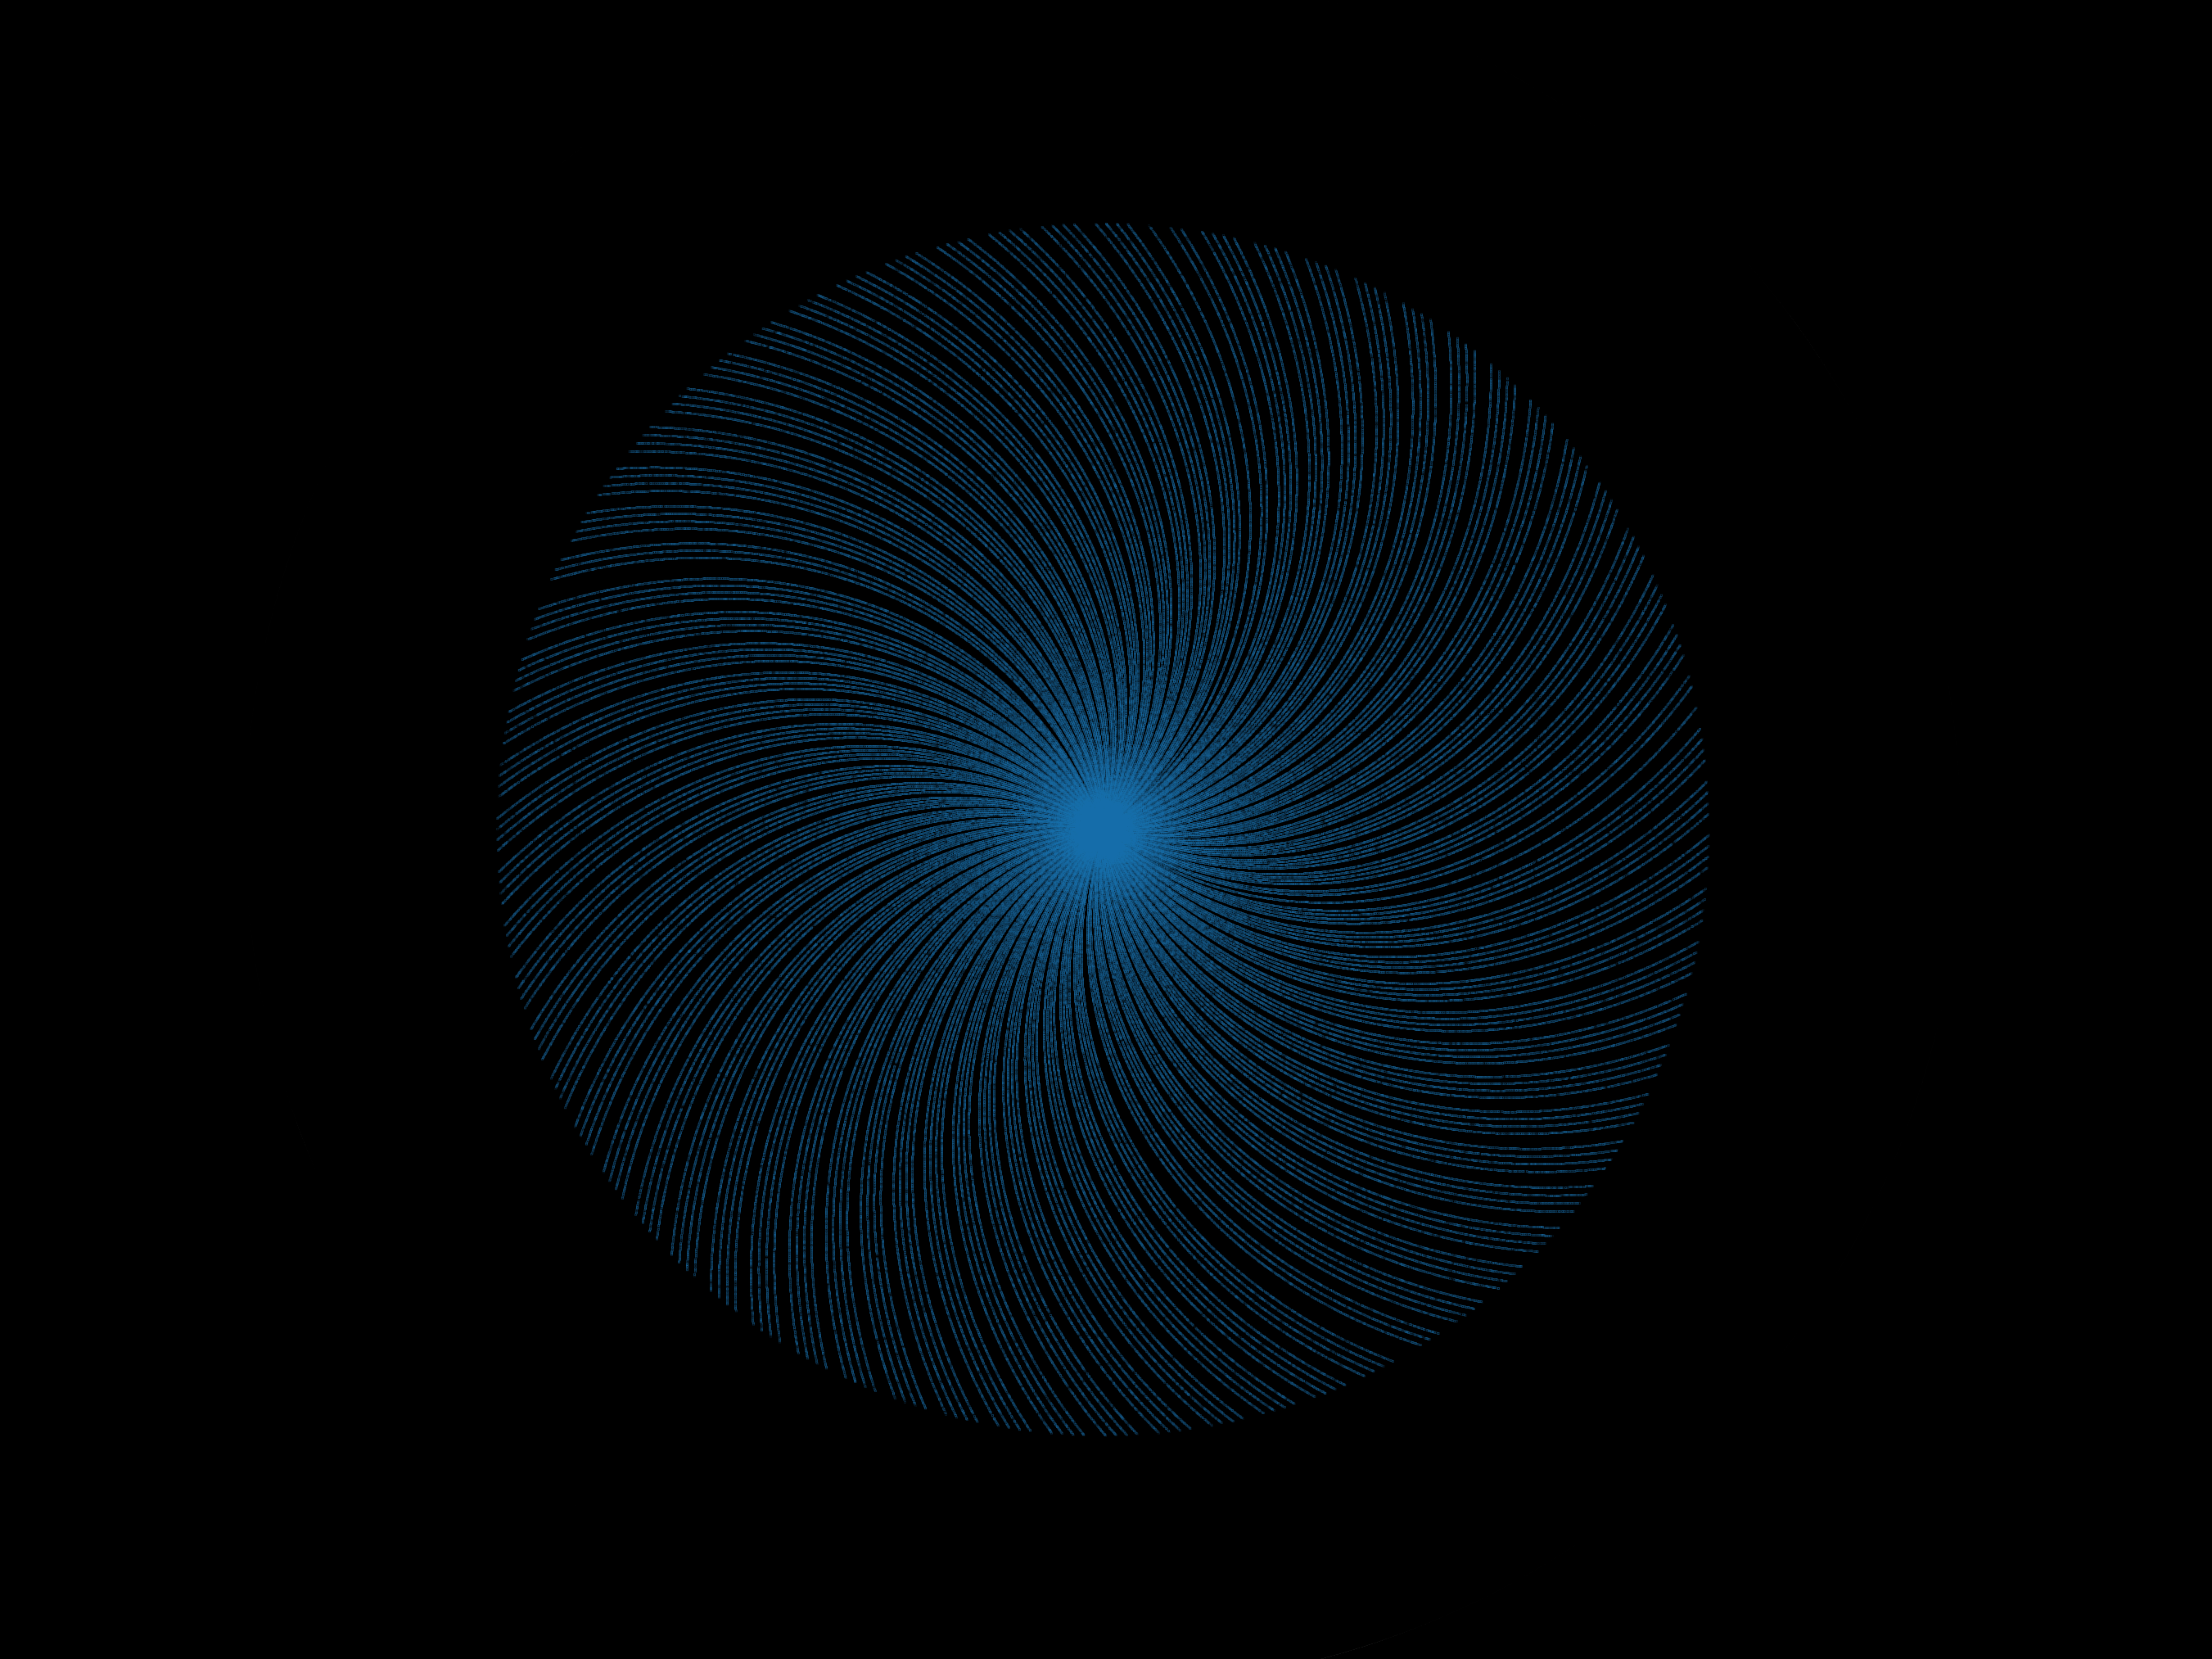
All 10 million:
2,500 looks pretty good. The spirals are clearly visible. Almost looks like a galaxy…
And plotting all 10 million, you can see a much larger spiral pattern emerging.
View the source code on Github.